PGFplots.net

Drawing plots and diagrams with LaTeX and PGFplots

Skip to content
Menu
  • Home
  • Resources
  • About
  • Authors
  • Learn TikZ and PGFplots
  • TikZによるLaTeXグラフィックス 単行本
Search

Tag: 2d

Polar plot of a sine function
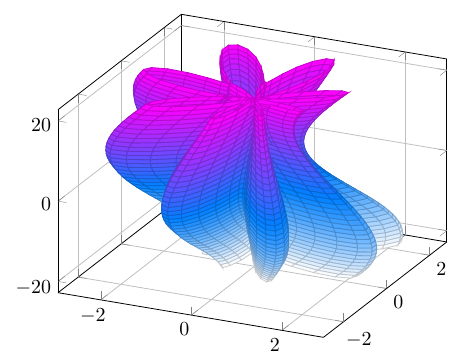
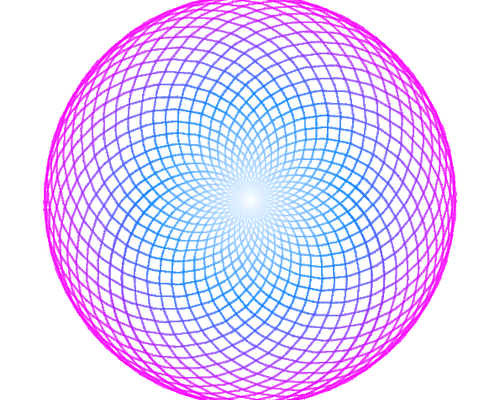
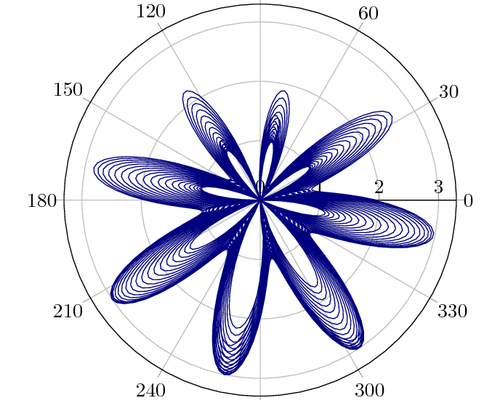
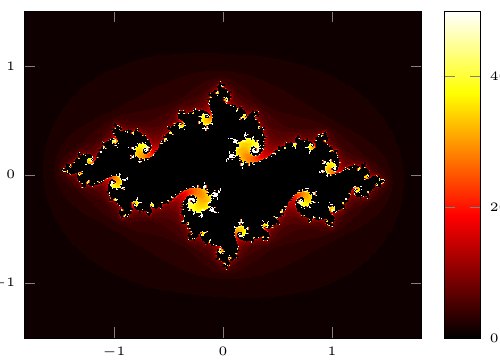
Posted onJanuary 10, 2021January 10, 2021Uncategorized

Polar plot of a sine function with factor in argument

Polar plot of sine based function
Posted onJanuary 10, 2021Uncategorized

Polar plot of sine based function

Highlighting and shading plot
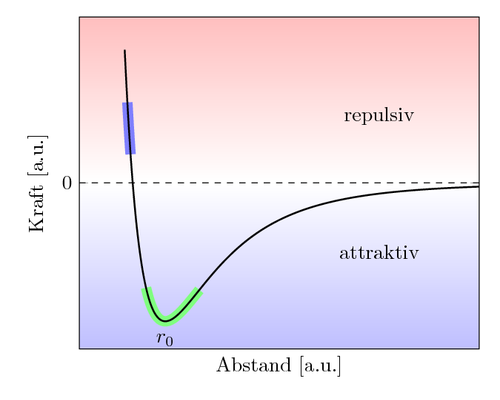
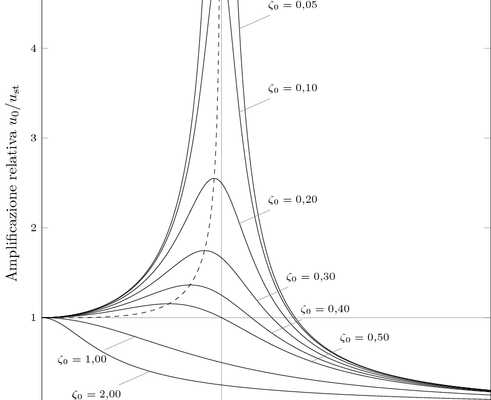
Posted onJanuary 10, 2021January 10, 2021Uncategorized

Highlighting parts of a curves and shading the plane

Harmonic elementary oscillator plot
Posted onJanuary 10, 2021January 10, 2021Uncategorized

Harmonic elementary oscillator

Julia set plot
Posted onJanuary 10, 2021March 10, 2021Uncategorized

Julia set

Mandelbrot set plot
Posted onJanuary 10, 2021March 10, 2021Uncategorized

Mandelbrot set

Edgeworth box plot
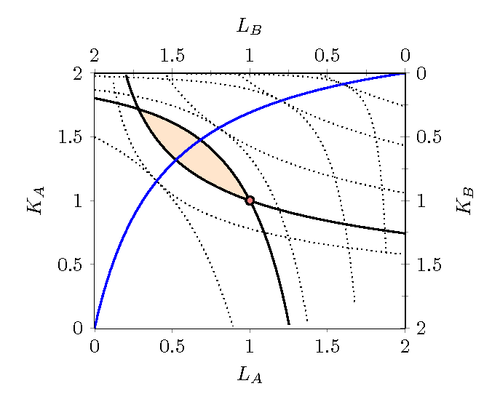
Posted onJanuary 10, 2021January 10, 2021Uncategorized

Edgeworth box-Optimal allocation of inputs for two economies

Regression plot with Residuals
Posted onJanuary 10, 2021May 8, 2022Uncategorized

Regression with Residuals

Weierstrass function plot
Posted onJanuary 10, 2021March 10, 2021Uncategorized

Weierstrass function

Posts pagination

Previous Page Page 1 Page 2 Page 3 … Page 5 Next Page
Creative Commons License
Licensed under a Creative Commons Attribution-ShareAlike 4.0 International License with © Copyright 2023 – pgfplots.net.
Want to learn TikZ in a fast way? Check this website and book here: TikZ.org for over a hundred of examples with online editing and compiling.

Privacy policy | Impressum
Magazine WordPress Themes by DesignOrbital
PGFplots.net
Proudly powered by WordPress Theme: Anther Pro.