


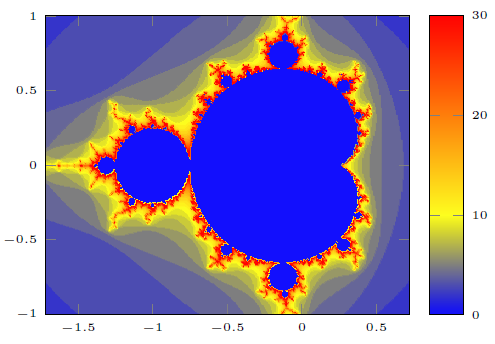
The Mandelbrot consists of points whose boundary is a two-dimensional fractal shape. It is named after the mathematician Benoit Mandelbrot. It’s computed using a lot of iterations, that’s why we use Lua here for the calculation.
The sampling is done via \addplot3 and the coloring by surf and shader=interp. LuaTeX is required. And it runs a while. 😉
It was posted on TeXwelt.
Compiling this example takes too long for TeXlive.net, so you may get a timeout error.
%!TEX lualatex
\documentclass{standalone}
\usepackage{pgfplots}
\pgfplotsset{width=7cm,compat=1.8}
\usepackage{luacode}
\usepackage{pgfplots}
\pgfplotsset{width=7cm, compat=1.10}
\usetikzlibrary{calc, intersections}	       %allows coordinate calculations.
\begin{luacode}
  function mandelbrot(cx,cy, max_iter, max)
    local x,y,xtemp,ytemp,squaresum,iter
    squaresum = 0
    x = 0
    y = 0
    iter = 0
    while (squaresum <= max) and (iter < max_iter)  do
      xtemp = x * x - y * y + cx
      ytemp = 2 * x * y + cy
      x = xtemp
      y = ytemp
      iter = iter + 1
      squaresum = x * x + y * y
    end
    local result = 0
    if (iter < max_iter) then
        result = iter
    end
    -- result = squaresum
    -- io.write("" .. cx .. ", " .. cy .. " = " .. result .. " (iter " .. iter .. " squaresum " .. squaresum .. ") \string\n")
    tex.print(result);
  end
\end{luacode}
\begin{document}
\begin{tikzpicture}
  \begin{axis}[
    colorbar,
    point meta max=30,
    tick label style={font=\tiny},
    view={0}{90}]
    \addplot3 [surf,domain=-1.5:0.5,shader=interp,domain y=-1:1,samples=300] {
        \directlua{mandelbrot(\pgfmathfloatvalueof\x,
        \pgfmathfloatvalueof\y,10000,4)}
    };
  \end{axis}
\end{tikzpicture}
\end{document}