


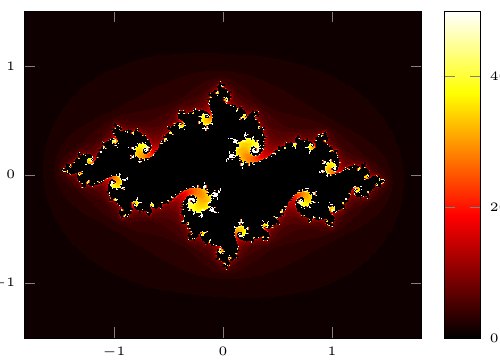
This is a picture of a Julia set, named after the French mathematician Gaston Julia. Computing requires a lot of iterations, that’s why we use Lua. The function for the set is z -> z^2 – 0.742 + 0.1i.
The example is very similar to the Mandelbrot example . One small difference is that we use a different color map.
Again, the sampling is done via \addplot3. surf and shader=interp do the coloring. Run with LuaLaTeX and have a coffee.
It was posted on: Fraktale mit pgfplots
Compiling this example takes too long for TeXlive.net, so you may get a timeout error.
%!TEX lualatex
\documentclass[border=5pt]{standalone}
\usepackage{pgfplots}
\pgfplotsset{width=7cm,compat=1.8}
\usepackage{luacode}
\begin{luacode}
  function julia(cx,cy, max_iter, max)
    local x,y,xtemp,ytemp,squaresum,iter
    squaresum = 0
    x = cx
    y = cy
    iter = 0
    while (squaresum <= max) and (iter < max_iter)  do
      xtemp = x * x - y * y - 0.742
      ytemp = 2 * x * y + 0.1
      x = xtemp
      y = ytemp
      iter = iter + 1
      squaresum = x * x + y * y
    end
    local result = 0
    if (iter < max_iter) then
        result = iter
    end
    -- result = squaresum
    -- io.write("" .. cx .. ", " .. cy .. " = " .. result .. " (iter " .. iter .. " squaresum " .. squaresum .. ") \string\n")
    tex.print(result);
  end
\end{luacode}
\begin{document}
\begin{tikzpicture}
  \begin{axis}[
    colormap/hot2,
    colorbar,
    axis equal,
    point meta max=50,
    tick label style={font=\tiny},
    view={0}{90}]
    \addplot3 [surf, domain = -1.82:1.82, shader = interp,
      domain y = -1.5:1.5, samples = 350]
      {\directlua{julia(\pgfmathfloatvalueof\x,\pgfmathfloatvalueof\y,10000,4)}
    };
  \end{axis}
\end{tikzpicture}
\end{document}