Posted onMarch 28, 2026March 28, 2026Uncategorized LaTeX Beginner’s Guide: Ranked #1 New Release on Amazon – Now 30% Off
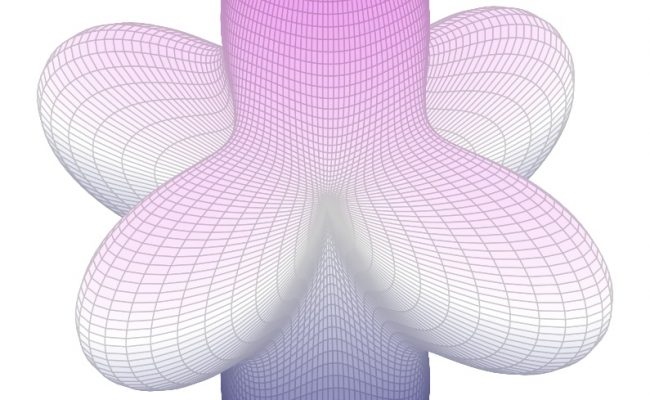
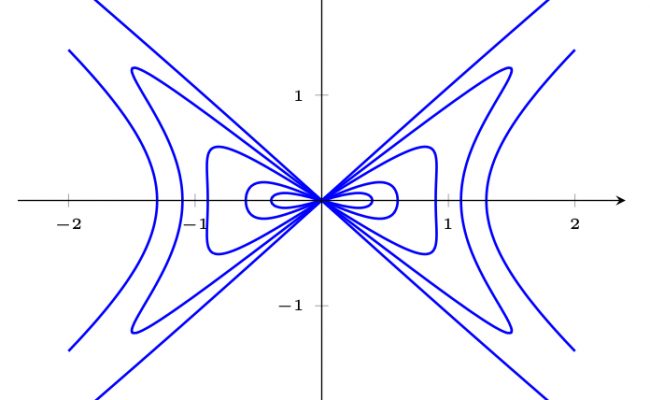
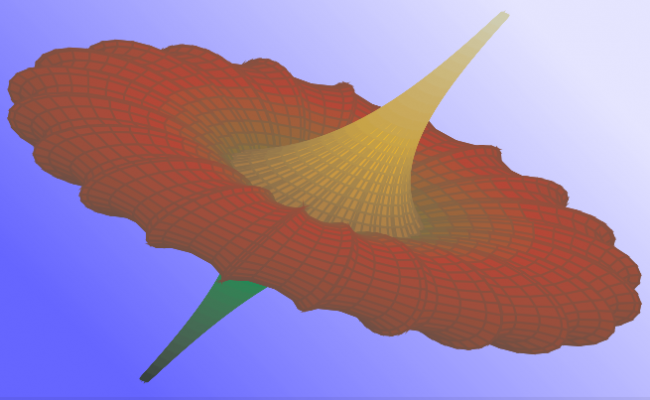
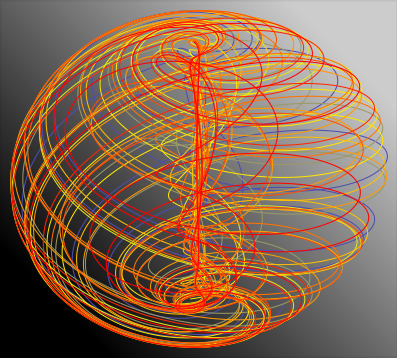
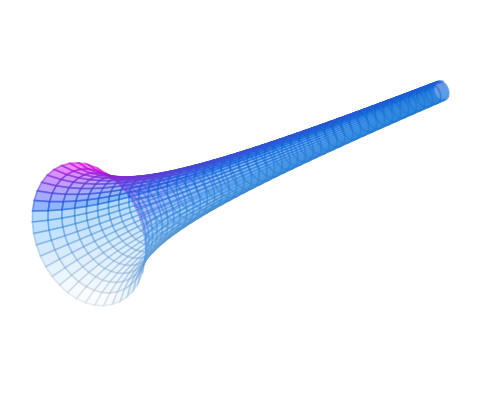
Posted onSeptember 21, 2025October 31, 2025Uncategorized Breather surface – a pseudosphere like a flower