


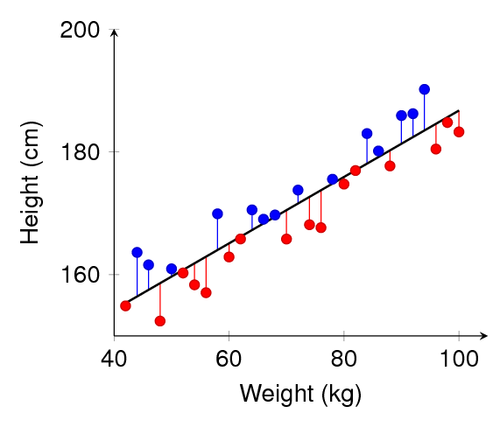
We will draw a regression line through some points, as in http://pgfplots.net/tikz/examples/regression-line/ . This time, we will implement a style for negative and positive residuals using an optional argument.
\documentclass[border=5pt]{standalone}
\usepackage{pgfplots}
\pgfplotsset{width=7cm,compat=1.8}
\usepackage{pgfplotstable}
\usepackage{helvet}
\usepackage[eulergreek]{sansmath}
\pgfmathsetseed{10} % set the random seed
\pgfplotstableset{ % Define the equations for x and y
    create on use/x/.style={create col/expr={42+2*\pgfplotstablerow}},
    create on use/y/.style={create col/expr={(0.6*\thisrow{x}+130)+8*rand}}
}
% create a new table with 30 rows and columns x and y:
\pgfplotstablenew[columns={x,y}]{30}\loadedtable

% Calculate the regression line
\pgfplotstablecreatecol[linear regression]{regression}{\loadedtable}

\pgfplotsset{
    colored residuals/.style 2 args={
        only marks,
        scatter,
        point meta=explicit,
        colormap={redblue}{color=(#1) color=(#2)},
        error bars/y dir=minus,
        error bars/y explicit,
        error bars/draw error bar/.code 2 args={
            \pgfkeys{/pgf/fpu=true}
            \pgfmathtruncatemacro\positiveresidual{\pgfplotspointmeta<0}
            \pgfkeys{/pgf/fpu=false}
            \ifnum\positiveresidual=0
                \draw [#2] ##1 -- ##2;
            \else
                \draw [#1] ##1 -- ##2;
            \fi
        },
        /pgfplots/table/.cd,
            meta expr=(\thisrow{y}-\thisrow{regression})/abs(\thisrow{y}-\thisrow{regression}),
            y error expr=\thisrow{y}-\thisrow{regression}
    },
    colored residuals/.default={red}{blue}
}
\begin{document}
\begin{tikzpicture}[every node/.style={font=\sffamily}]
\begin{axis}[
xlabel=Weight (kg), % label x axis
ylabel=Height (cm), % label y axis
axis lines=left, %set the position of the axes
xmin=40, xmax=105, % set the min and max values of the x-axis
ymin=150, ymax=200, % set the min and max values of the y-axis
  tick label style = {font=\sansmath\sffamily},
  every axis label = {font=\sansmath\sffamily},
  legend style = {font=\sansmath\sffamily},
  label style = {font=\sansmath\sffamily},
]

\makeatletter
\addplot [colored residuals] table {\loadedtable};
\addplot [
    no markers,
    thick, black
] table [y=regression] {\loadedtable} ;
\end{axis}

\end{tikzpicture}
\end{document}