


That plot is from my German blog TikZ.de.
I planned to model this nice cake:

(Foto by Guido Draheim).
Like a cruller, just, ehm, more digital and mathematical.
How do we draw it?
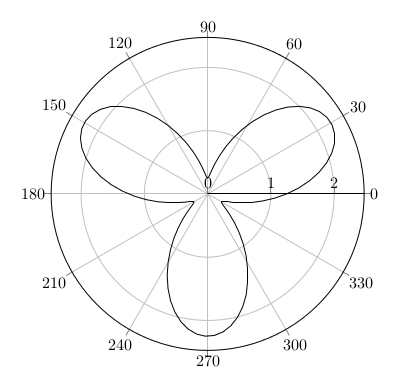
Let’s think of a cross-section. In polar coordinates the sine function sin(x) gives a circle, sin(3x) are three leaves, we add some radius (1,25) as a middle piece. That gives us the function sin(3x) + 1.25 in polar coordinates:
We embed it in the three-dimensional space, like in the xy plane with z=0 as (x,y,z)(t) = ( cos(t)(sin(3t)+1.25), sin(t)(sin(3t) + 1.25), 0 ):
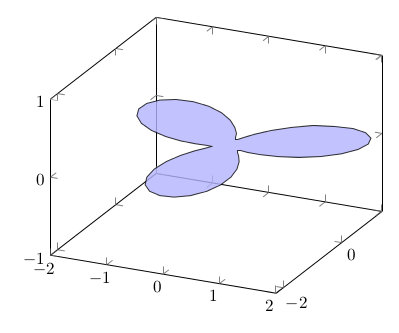
Or rotated a bit:

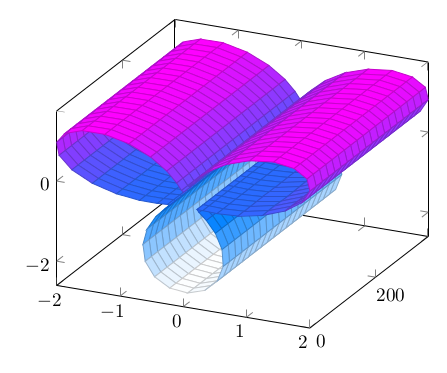
We can move it in the space by drawing in the xz plane and move with linear y: (x,y,z)(t) = ( cos(t)(sin(3t)+1.25), t, sin(t)(sin(3t)+1.25) ). That becomes:
But we want to rotate it. For doing this, we use a torus function , like this one:
x(t,s) = (2+cos(t))cos(s+pi/2)
y(t,s) = (2+cos(t))sin(s+pi/2)
z(t,s) = sin(t)
We combine it with our function:
x(t,s) = (6+(sin(3t)+1.25)cos(t))cos(s)
y(t,s) = (6+(sin(3t)+1.25)cos(t))sin(s)
z(t,s) = (sin(3t)+1.25)sin(t)
Here is a cut, half circle rotation:

Here is the whole torus based rotated 3d image of the original function:

And now to the twist. We can twist it by adding a multiple of t or y in the function argument and achieve the rotation with growing y:

Math done, let’s add color. Ok, and now the code:
% !TEX lualatex
% Mit LuaLaTeX übersetzen, weil die Berechnungen zu aufwendig für pdfLaTeX sind
\documentclass{standalone}
\usepackage{pgfplots}
\usetikzlibrary{backgrounds}
\begin{document}
\begin{tikzpicture}
  \begin{axis}[axis equal,
      hide axis,
      /tikz/background rectangle/.style = {
        left color    = black,
        right color   = black!20,
        shading angle = 135,
      },
      show background rectangle
    ]
    \addplot3[
      surf,
      shader      = flat,
      miter limit = 1,
      domain      = 0:360,
      y domain    = 0:360,
      samples     = 60,% low res for online compiler, take 100 for the image below,
      samples y   = 40,% % low res for online compiler, take 70 for the image below,
      z buffer    = sort,
      colormap/hot2,
    ]
    ( {(6+(sin(3*(x+3*y))+1.25)*cos(x))*cos(y)},
      {(6+(sin(3*(x+3*y))+1.25)*cos(x))*sin(y)},
      {((sin(3*(x+3*y))+1.25)*sin(x))} );
  \end{axis}
\end{tikzpicture}
\end{document}
With more resolution, samples=100 and samples y=70:

All codes and explanation are also here:
- Deutsch: Drehtransformation mit pgfplots, in German on TeXwelt.de
- Englisch: Rotation transformation of a parametrized plot, with answer by cmhughes on TeX.SE
- Französisch: Représenter un vissage à l’aide de pgfplots, French post on TeXnique.fr