


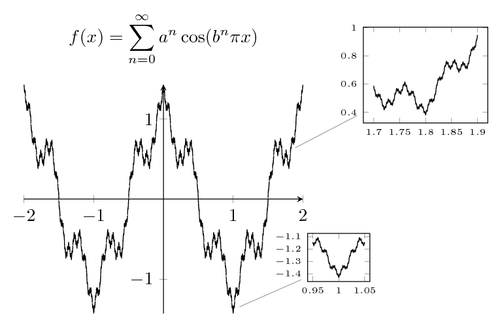
The Weierstrass function is a pathological one: is continuous everywhere but differentiable nowhere.
The original code was written by Herbert Voss on TeX.SE, Stefan Kottwitz added the zoomed out plots and legend.
LuaLaTeX is required, so currrently it doesn’t run with writeLaTeX, but you can run it on your own computer: just use lualatex instead of pdflatex.
Update, 2018: due to changes in LuaTeX, this example may need this line at the beginning of your code to work on your computer:
\RequirePackage{luatex85,shellesc}
%!TEX lualatex
\documentclass[tikz,border=0.125cm]{standalone}
\usepackage{pgfplots}
\pgfplotsset{width=7cm,compat=1.8}
\usepackage{luacode}
\begin{luacode}
  function weierstrass(x0, x1, n, a, b, epsilon)
    local dx = (x1-x0)/n
    local x = x0
    local out=assert(io.open("tmp.data","w"))
    local y,k,dy
    while (x <= x1) do
      y = 0
      k = 0
      repeat
        dy = math.pow(a,k) * math.cos(math.pow(b,k)*math.pi*x)
        y = y + dy
        k = k + 1
      until (math.abs(dy) < epsilon)
      out:write(x, " ", y, "\string\n")
      x = x + dx
    end
    out:close()
  end
\end{luacode}
\begin{document}
\begin{tikzpicture}[every pin/.style={fill=white},pin distance=1.2cm]
  \directlua{weierstrass(-2,2,5000,0.3,5,1.e-12)}%
  \begin{axis}[axis lines=middle,domain=-2:2]
    \addplot [thin, line join=round] table {tmp.data};
    \coordinate (p1) at (axis cs:1,-1.38);
    \coordinate (p2) at (axis cs:1.8,0.6);
    \coordinate (legend) at (axis cs:0,2);
  \end{axis}
  \directlua{weierstrass(0.95,1.05,5000,0.3,5,1.e-12)}%
  \node[pin=3:{%
    \begin{tikzpicture}[baseline,trim axis left,trim axis right]
      \begin{axis}[tiny,axis lines=box,domain=0.95:1.05,scale=0.5]
        \addplot [thin, line join=round] table {tmp.data};
      \end{axis}
    \end{tikzpicture}%
  }] at (p1) {};
  \directlua{weierstrass(1.7,1.9,5000,0.3,5,1.e-12)}%
  \node[pin=3:{%
    \begin{tikzpicture}[baseline,trim axis left,trim axis right]
      \begin{axis}[tiny,axis lines=box,domain=1.7:1.9]
        \addplot [thin, line join=round] table {tmp.data};
      \end{axis}
    \end{tikzpicture}%
  }] at (p2) {};
  \node at (legend)
    {$\displaystyle f(x) = \sum_{n=0}^\infty a^n \cos(b^n \pi x)$};
\end{tikzpicture}
\end{document}