


This example was written for an article on pgfplots for ArsTeXnica, the GuIT’s periodical.
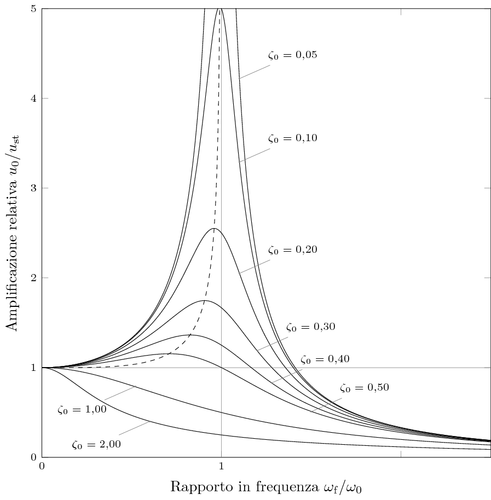
The plot family shows the resonance of an harmonic elementary oscillators in terms of resonance frequency. The original code was based on gnuplot for numerical computation, but this version is a pdflatex standalone solution.
Link to the pubblication: http://www.guitex.org/home/it/numero-12
Link to the article: http://www.guitex.org/home/images/ArsTeXnica/AT012/grafici-pgfplots.pdf
\documentclass[margin=10pt]{standalone}
\usepackage{pgfplots}
\pgfplotsset{compat=1.8}
\usepackage{lmodern}

\tikzset{
  every pin/.style={
      font=\scriptsize,
      pin distance=4ex},
  small dot/.style={
      fill=gray,
      circle,
      scale=0.1}
}

\begin{document}
\begin{tikzpicture}
  \begin{axis}[
    % labels
    tick label style={font=\scriptsize},
    xlabel={Rapporto in frequenza $\omega_\mathrm{f}/\omega_0$},
    ylabel={Amplificazione relativa $u_0/u_\mathrm{st}$},
    ytick={0,1,2,3,4,5},
    xtick={0,1,2,3},
    xticklabels={0,1,,},
    %
    % plot lines property
    no markers,
    line width=0.3pt,
    cycle list={{black,solid}},
    %
    % dominio 2D
    samples=200,
    smooth,
    domain=0:2.5,
    xmin=0, xmax=2.5,
    ymin=0, ymax=5.0,
    %
    % canvas dimensions
    width=12cm, height=12cm
    ]

    % horizontal help line
    \draw[help lines] (axis cs:0,1) -- (axis cs:2.5,1);
    % vertical help line
    \draw[help lines] (axis cs:1,0) -- (axis cs:1,5);

    % tracciamento curve
    \addplot {1/sqrt((1-x^2)^2+4*0.05^2*x^2)};
    \addplot {1/sqrt((1-x^2)^2+4*0.10^2*x^2)};
    \addplot {1/sqrt((1-x^2)^2+4*0.20^2*x^2)};
    \addplot {1/sqrt((1-x^2)^2+4*0.30^2*x^2)};
    \addplot {1/sqrt((1-x^2)^2+4*0.40^2*x^2)};
    \addplot {1/sqrt((1-x^2)^2+4*0.50^2*x^2)};
    \addplot {1/sqrt((1-x^2)^2+4*1.00^2*x^2)};
    \addplot {1/sqrt((1-x^2)^2+4*2.00^2*x^2)};

    % tracciamento funzione dei massimi
    \addplot[dashed,domain=0:0.99] {1/sqrt(1-x^4)};

    % etichette curve
    \node[small dot,pin=30:{$\zeta_0=0{,}05$}] at
      (axis cs:1.10,4.22) {};
    \node[small dot,pin=30:{$\zeta_0=0{,}10$}] at
      (axis cs:1.10,3.29) {};
    \node[small dot,pin=30:{$\zeta_0=0{,}20$}] at
      (axis cs:1.10,2.05) {};
    \node[small dot,pin=30:{$\zeta_0=0{,}30$}] at
      (axis cs:1.20,1.19) {};
    \node[small dot,pin=30:{$\zeta_0=0{,}40$}] at
      (axis cs:1.28,0.83) {};
    \node[small dot,pin=30:{$\zeta_0=0{,}50$}] at
      (axis cs:1.50,0.51) {};

    \node[small dot,pin=210:{$\zeta_0=1{,}00$}] at
      (axis cs:0.52,0.79) {};
    \node[small dot,pin=210:{$\zeta_0=2{,}00$}] at
      (axis cs:0.60,0.40) {};
  \end{axis}
\end{tikzpicture}
\end{document}