


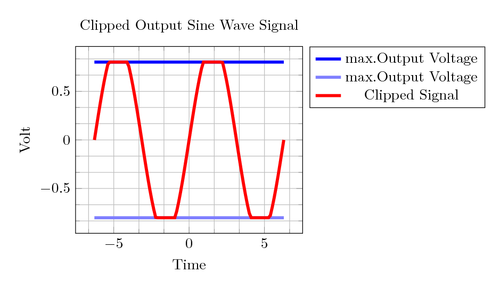
A sine curve, where the y-values do not exceed a certain value.
PGFPlots has two different types of clipping: the first is the graphical clipping operation which is activated by clip, the second is based on coordinate value manipulation, more precisely by restrict y to domain*.
This topic was discussed on: LaTeX-Community.org
\documentclass[border=10pt]{standalone}
\usepackage{pgfplots}
\pgfplotsset{width=7cm,compat=1.8}
% Create a function for generating inverse normally distributed numbers using the Box–Muller transform
\pgfmathdeclarefunction{invgauss}{2}{%
  \pgfmathparse{sqrt(-2*ln(#1))*cos(deg(2*pi*#2))}%
}
\newcommand*{\val}{0.8}% the absolut value of the limit
% Code for brownian motion
\begin{document}
  \begin{tikzpicture}
    \begin{axis}[
        domain     = -6.283:6.283,
        grid       = both, minor tick num=2,
        title      = Clipped Output Sine Wave Signal,
        xlabel     = Time,
        ylabel     = Volt,
        legend pos = outer north east,
        restrict y to domain* = -\val:\val
      ]
      \addplot[blue, line width=2pt] {\val};
      \addplot[blue!50, line width=2pt] {-\val};
      \addplot+[no marks, samples=100, red, line width=2pt] {sin(deg(x))};
      \legend{max.Output Voltage, max.Output Voltage, Clipped Signal}
    \end{axis}
  \end{tikzpicture}
\end{document}