


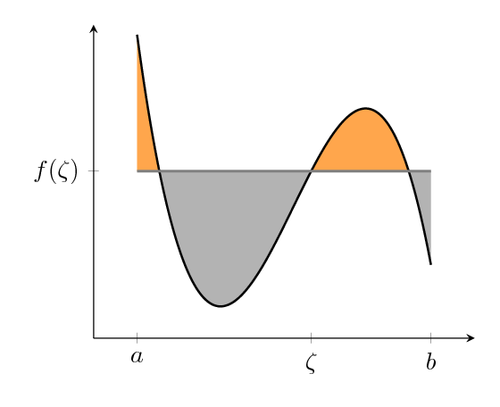
With pgfplots 1.10 and its fillbetween library we can fill the area between curves in a new convenient way:
- draw the first function and give it a name
- draw the second function and name it too
- add a fill between plot
This Code was posted by Stefan Kottwitz to TeX.SE, modifying an answer of Gonzalo Medina there.
\documentclass[border=10pt]{standalone}
\usepackage{pgfplots}
\pgfplotsset{width=7cm, compat=1.10}
\usepgfplotslibrary{fillbetween}
\pgfmathdeclarefunction{poly}{0}{\pgfmathparse{-x^3+5*(x^2)-3*x-3}}
\begin{document}
\begin{tikzpicture}
  \begin{axis}[
    axis y line = left,
    axis x line = bottom,
    xtick       = {-1.2,2,4.2},
    xticklabels = {$a$,$\zeta$,$b$},
    ytick       = {3},
    yticklabels = {$f(\zeta)$},
    samples     = 160,
    domain      = -1.2:4.2,
    xmin = -2, xmax = 5,
    ymin = -5, ymax = 10,
  ]
  \addplot[name path=poly, black, thick, mark=none, ] {poly};
  \addplot[name path=line, gray, no markers, line width=1pt] {3};
  \addplot fill between[
    of = poly and line,
    split, % calculate segments
    every even segment/.style = {orange!70},
    every odd segment/.style  = {gray!60}
  ];
\end{axis}
\end{tikzpicture}
\end{document}