PGFplots.net
Drawing plots and diagrams with LaTeX and PGFplots
Skip to content
Menu
Home
Resources
About
Authors
Learn TikZ and PGFplots
TikZによるLaTeXグラフィックス 単行本
Search
Search for:
Search
Author
:
Christian Feuersänger
Posted on
January 10, 2021
January 10, 2021
Uncategorized
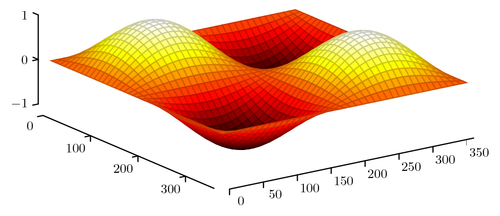
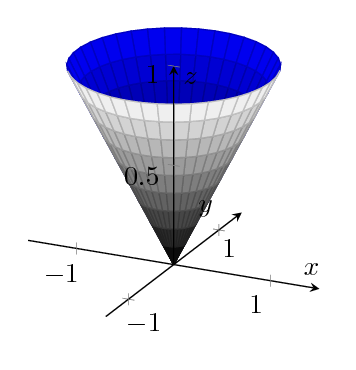
Tufte style axes in 3D
Posted on
January 10, 2021
January 10, 2021
Uncategorized
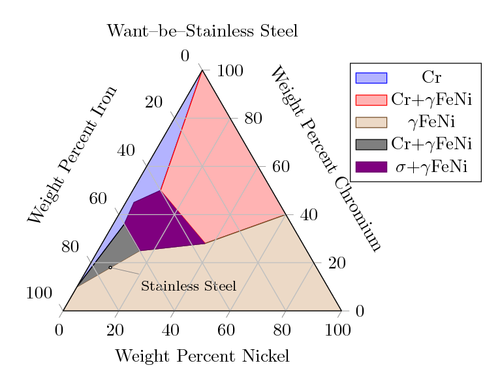
Ternary diagram
Posted on
January 10, 2021
January 10, 2021
Uncategorized
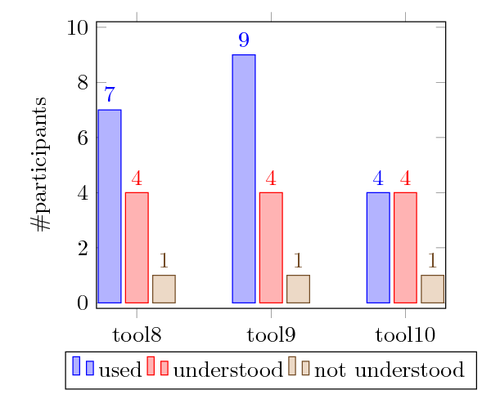
Bar plot
Posted on
January 10, 2021
December 8, 2024
Uncategorized
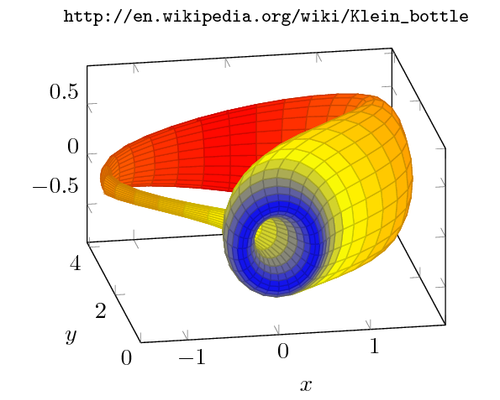
Klein bottle
Posted on
January 10, 2021
January 10, 2021
Uncategorized
Surface plot with interior colors
Posted on
January 10, 2021
January 10, 2021
Uncategorized
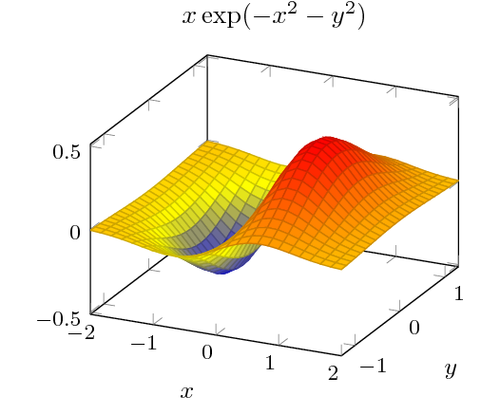
Surface plot of a math function
Posted on
January 10, 2021
January 10, 2021
Uncategorized
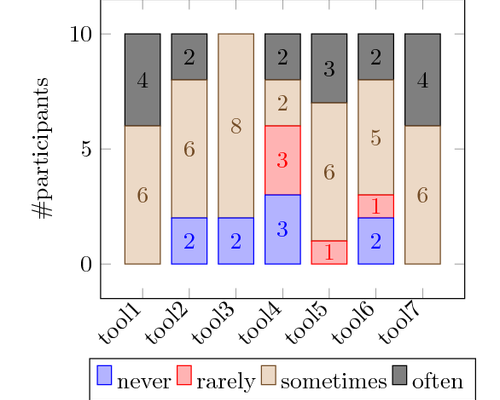
Stacked bar plot
Posted on
January 9, 2021
June 17, 2023
Uncategorized
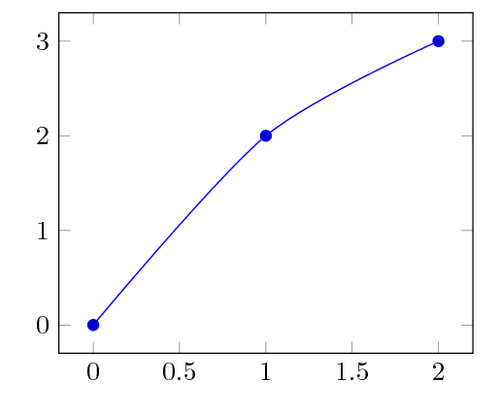
Smooth plot
Posted on
January 9, 2021
June 17, 2023
Uncategorized
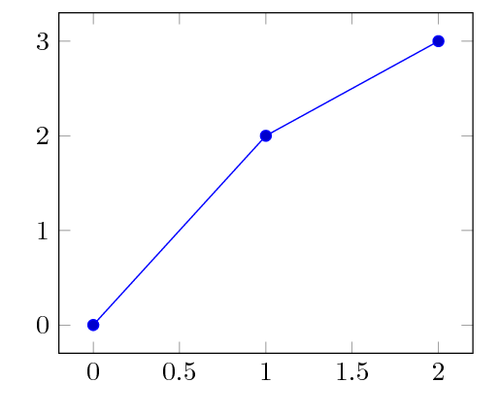
Linear plot
Posts pagination
Page
1
Page
2
Next Page