


Constant plots draw lines parallel to the x-axis to connect coordinates. The discontinuous edges may be drawn or not, and marks may be placed on left or right ends.
The code is from the PGFPlots 1.10 manual: “4.5.2 Smooth Plots”.
\documentclass[border=10pt]{standalone}
\usepackage{pgfplots}
\pgfplotsset{width=7cm,compat=1.8}
\begin{document}
\begin{tikzpicture}
\begin{axis}
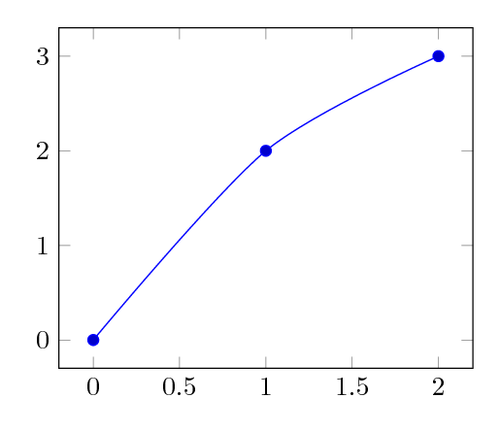
\addplot+[smooth] coordinates
{(0,0) (1,2) (2,3)};
\end{axis}
\end{tikzpicture}
\end{document}