PGFplots.net
Drawing plots and diagrams with LaTeX and PGFplots
Skip to content
Menu
Home
Resources
About
Authors
Learn TikZ and PGFplots
TikZによるLaTeXグラフィックス 単行本
Search
Search for:
Search
Author
:
Christian Feuersänger
Posted on
January 9, 2021
January 10, 2021
Uncategorized
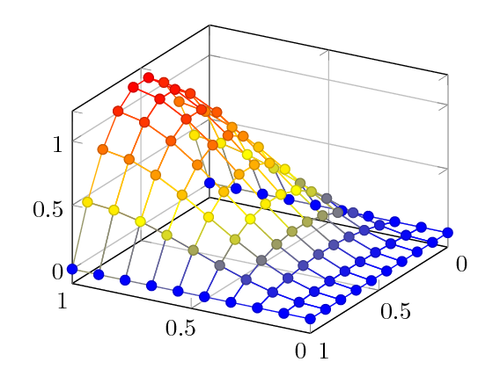
Mesh plot
Posted on
January 9, 2021
January 10, 2021
Uncategorized
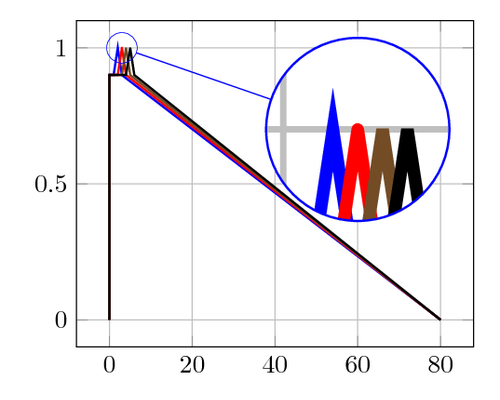
Magnifying a part of the plot
Posted on
January 9, 2021
January 10, 2021
Uncategorized
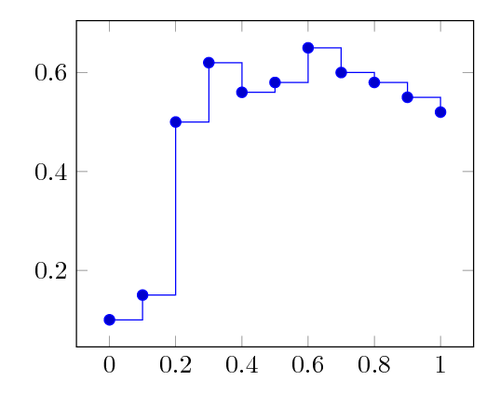
Constant plot
Posted on
January 9, 2021
January 10, 2021
Uncategorized
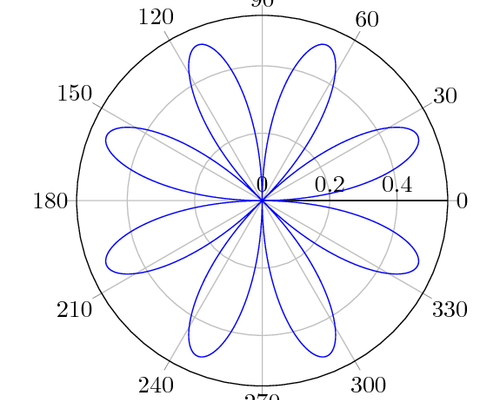
Polar plot
Posted on
January 9, 2021
January 10, 2021
Uncategorized
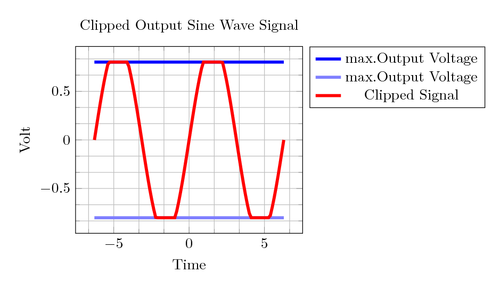
Clipped Output Sine Wave Signal
Posted on
January 9, 2021
January 10, 2021
Uncategorized
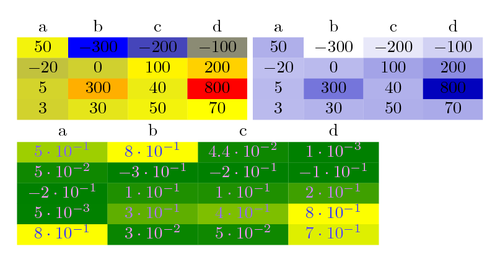
Color maps
Posts pagination
Previous Page
Page
1
Page
2