


We would like to create a heatmap using TikZ. Basically, we have a table of values and each value is assigned a color.
We map the numerical data linearly into a colormap of pgfplots.
A colormap is a map where the smallest number is mapped to the first color and the largest number is mapped to the last color. Anything in-between is interpolated linearly, i.e. a number which is in the middle between the smallest and the largest will be mapped to a color “in the middle of the colormap”. Note that a colormap can be defined by means of any number of colors, not just two. In that case, the intervals will be glued together (compare pgfplots manual).
This allows continous colors.
The style here assumes that you set the minimum and maximum value manually. If a number is below or above the minimum/maximum, it will be clipped automatically.
The style respects any output format instructions, i.e. you can apply number formatting and/or postprocessing as with any other data in pgfplotstable. It also makes the code a little bit more complex.
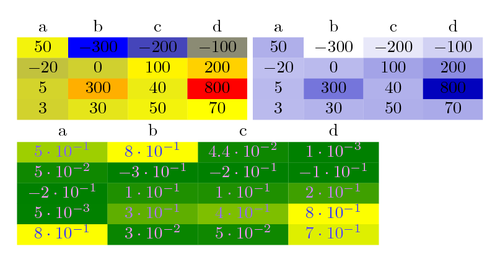
The last entry shows that data in the range [0,1] also seems to work reasonably… and it also shows that the text (foreground) color can be changed in dependence on mapped color.
My document shows two different colormaps for the same data. You may want to study the pgfplots manual to learn how to customize colormaps.
This code was written by Christian Feuersänger on TeX.SE.
\documentclass[varwidth=true,border=10pt]{standalone}
\usepackage{pgfplots}
\pgfplotsset{width=7cm,compat=1.8}
\usepackage{colortbl}
\usepackage{pgfplotstable}
\pgfplotstableset{
    /color cells/min/.initial=0,
    /color cells/max/.initial=1000,
    /color cells/textcolor/.initial=,
    %
    % Usage: 'color cells={min=,
    %   max = }
    color cells/.code={%
        \pgfqkeys{/color cells}{#1}%
        \pgfkeysalso{%
            postproc cell content/.code={%
                %
                \begingroup
                %
                % acquire the value before any number printer changed
                % it:
                \pgfkeysgetvalue{/pgfplots/table/@preprocessed
                  cell content}\value
                \ifx\value\empty
                    \endgroup
                \else
                \pgfmathfloatparsenumber{\value}%
                \pgfmathfloattofixed{\pgfmathresult}%
                \let\value=\pgfmathresult
                %
                % map that value:
                \pgfplotscolormapaccess
                    [\pgfkeysvalueof{/color cells/min}:\pgfkeysvalueof{/color
                      cells/max}]
                    {\value}
                    {\pgfkeysvalueof{/pgfplots/colormap name}}%
                % now, \pgfmathresult contains {,,}
                %
                % acquire the value AFTER any preprocessor or
                % typesetter (like number printer) worked on it:
                \pgfkeysgetvalue{/pgfplots/table/@cell content}\typesetvalue
                \pgfkeysgetvalue{/color cells/textcolor}\textcolorvalue
                %
                % tex-expansion control
                % see http://tex.stackexchange.com/questions/12668/
                \toks0=\expandafter{\typesetvalue}%
                \xdef\temp{%
                    \noexpand\pgfkeysalso{%
                        @cell content={%
                            \noexpand\cellcolor[rgb]{\pgfmathresult}%
                            \noexpand\definecolor{mapped
                              color}{rgb}{\pgfmathresult}%
                            \ifx\textcolorvalue\empty
                            \else
                                \noexpand\color{\textcolorvalue}%
                            \fi
                            \the\toks0 %
                        }%
                    }%
                }%
                \endgroup
                \temp
                \fi
            }%
        }%
    }
}
\begin{document}
\pgfplotstabletypeset[
    color cells={min=-300,max=800},
    col sep=comma,
]{
    a,b,c,d
    50,-300,-200,-100
    -20,0,100,200
    5,300,40,800
    3,30,50,70
}
%
%
\pgfplotstabletypeset[
    color cells={min=-300,max=800},
    col sep=comma,
    /pgfplots/colormap={whiteblue}{rgb255(0cm)=(255,255,255);
      rgb255(1cm)=(0,0,188)},
]{
    a,b,c,d
    50,-300,-200,-100
    -20,0,100,200
    5,300,40,800
    3,30,50,70
}

\pgfplotstabletypeset[
    color cells={min=0,max=0.8,textcolor=-mapped color!80!black},
    /pgfplots/colormap/greenyellow,
    /pgf/number format/sci,
]{
    a   b   c   d
    5e-1    8e-1    4.4e-2  1e-3
    0.050   -0.300  -0.200  -0.100
    -0.20   0.1 0.100   0.200
    0.005   0.300   0.40    0.800
    0.8 0.030   0.050   0.70
}
\end{document}