


A mesh plot uses different colors for each mesh segment. The color is determined using a “color coordinate” which is also called “meta data” throughout this document. It is the same data which is used for surface and scatter plots as well.
The code is from the PGFPlots 1.10 manual: “4.6.5 Mesh Plots”.
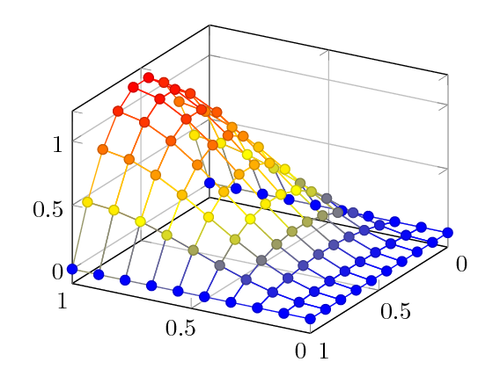
\documentclass[border=10pt]{standalone}
\usepackage{pgfplots}
\pgfplotsset{width=7cm,compat=1.8}
\begin{document}
\begin{tikzpicture}
	\begin{axis}[grid=major,view={210}{30}]
	\addplot3+[mesh,scatter,samples=10,domain=0:1]
		{5*x*sin(2*deg(x)) * y*(1-y)};
	\end{axis}
\end{tikzpicture}
\end{document}