


Both mesh and surface plots are actually special parametrized plots where x and y are on cartesian grid points. Parameterized plots just need a special way to provide the coordinates.
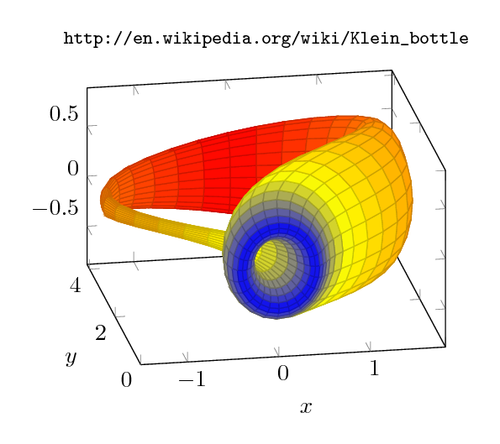
Her we plot the Klein bottle, which is an example of a non-orientable surface.
The code is from the PGFPlots 1.10 manual: “4.6.9 Parameterized Plots”. (GPL3+ license)
\documentclass[border=10pt]{standalone}
\usepackage{pgfplots}
\pgfplotsset{width=7cm,compat=1.8}
\usepackage{url}
\begin{document}
\begin{tikzpicture}
	\begin{axis}[
		xlabel=$x$,
		ylabel=$y$,
		view/h=-10,
		title=\footnotesize
 \url{http://en.wikipedia.org/wiki/Klein_bottle},
	]
	\addplot3[
		surf,
		z buffer=sort,
		colormap={periodic}{%
			color=(blue)
			   color=(yellow)
			      color=(orange)
				     color=(red)
			      color=(orange)
	           color=(yellow)
	        color=(blue)},
		domain=0:180, domain y=0:360,
		samples=41, samples y=25,
		variable=\u, variable y=\v,
		point meta=u,
		]
		({-2/15 * cos(u) * (
		    3*cos(v) - 30*sin(u)
		  + 90 *cos(u)^4 * sin(u)
		  - 60 *cos(u)^6 * sin(u)
		  + 5 * cos(u)*cos(v) * sin(u))
		 },
		 {-1/15 * sin(u) * (3*cos(v)
		  - 3*cos(u)^2 * cos(v)
		  - 48 * cos(u)^4*cos(v)
		  + 48*cos(u)^6 *cos(v)
		  - 60 *sin(u)
		  + 5*cos(u)*cos(v)*sin(u)
		  - 5*cos(u)^3 * cos(v) *sin(u)
		  - 80*cos(u)^5 * cos(v)*sin(u)
		  + 80*cos(u)^7 * cos(v) * sin(u))
		 },
		 {2/15 * (3 + 5*cos(u) *sin(u))*sin(v)});
	\end{axis}
\end{tikzpicture}
\end{document}