PGFplots.net
Drawing plots and diagrams with LaTeX and PGFplots
Skip to content
Menu
Home
Resources
About
Authors
Learn TikZ and PGFplots
TikZによるLaTeXグラフィックス 単行本
Search
Search for:
Search
Tag
:
clipping
Posted on
January 10, 2021
October 3, 2025
Uncategorized
Filling the space below a surface plot
Posted on
January 9, 2021
January 10, 2021
Uncategorized
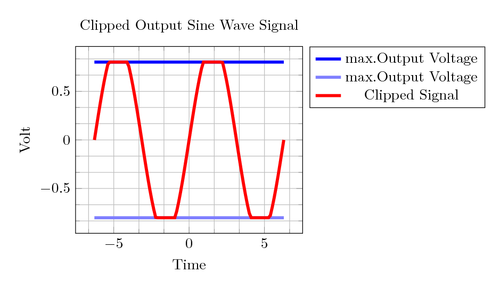
Clipped Output Sine Wave Signal