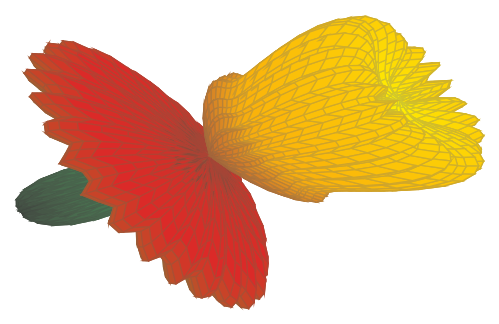
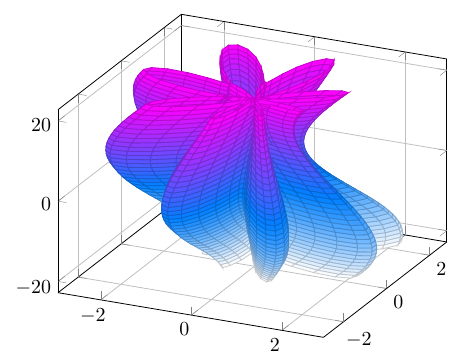
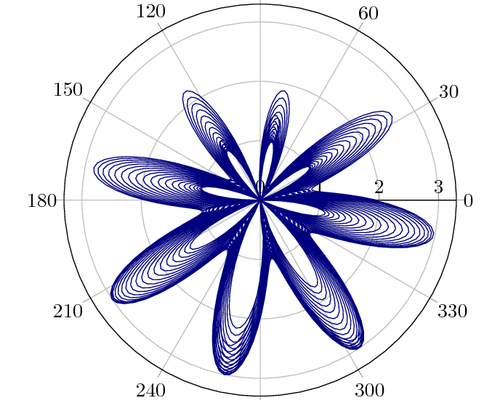
This Lemniscate envelope is generated by sweeping a circle, which has its center on a hyperbola. This code was written by Pouya on TeX.SE. LuaLaTeX…
For drawing a spiral cone, we need to find an appropriate parametrization. This code was written by Gonzalo Medina on TeX.SE. \documentclass[border=5pt]{standalone} \usepackage{pgfplots} \pgfplotsset{width=7cm,compat=1.8} \usetikzlibrary{decorations.markings}…
For displaying the total effect of a series of values, a waterfall chart can be useful. For example this chart, taken from “The Economist”, illustrates…
We would like to make an image to illustrate the construction of a spiral capacitor. These are made of spiral coiled films. It’s like a…
Using PGFPlotstable, we can use a naive numerical integration scheme to find the function directly within LaTeX. This code was written by Jake on TeX.SE.…
This is one I like from my thesis. It illustrates the predicted boundaries for boundary layer transition mechanisms on a cylindrical afterbody at incidence: free…
Here, the trick is to use stack plots=y together with closedcycle to create the error bands. We define a new command, \addplotwitherrorbands[<optional styles>]{<function>}{<positive error>} {<negative…
I enjoy the simplicity of the code and the quality of the result. It uses pgfplots to display streamline data for vortex shedding from a…