

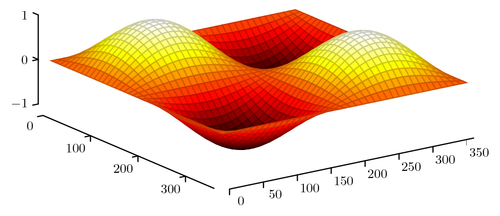
Here you can sdee Tufte style axes in 3D. The axis affect is achieved by shifting axes, ticks and labels.
The command \pgfplotspointouternormalvectorofticklabelaxis{x} is a shortcut for \pgfplotspointouternormalvectorofaxis{\pgfplotsticklabelaxisspec{x}}. The documentation for \pgfplotspointouternormalvectorofticklabelaxis is missing in the reference manual.
Note that this shift is incompatible with the grid lines (by construction!). To see this, try to add grid=major and you will see the the descriptions would be slightly off.
This example was written by Christian Feuersänger on TeX.SE.
\documentclass[border=5pt]{standalone}
\usepackage{pgfplots}
\def\axisdefaultwidth{360pt}
\pgfplotsset{
  every axis/.append style = {thick},tick style = {thick,black},
  %
  % #1 = x, y, or z
  % #2 = the shift value
  /tikz/normal shift/.code 2 args = {%
    \pgftransformshift{%
        \pgfpointscale{#2}{\pgfplotspointouternormalvectorofticklabelaxis{#1}}%
    }%
  },%
  %
  range3frame/.style = {
    tick align        = outside,
    scaled ticks      = false,
    enlargelimits     = false,
    ticklabel shift   = {10pt},
    axis lines*       = left,
    line cap          = round,
    clip              = false,
    xtick style       = {normal shift={x}{10pt}},
    ytick style       = {normal shift={y}{10pt}},
    ztick style       = {normal shift={z}{10pt}},
    x axis line style = {normal shift={x}{10pt}},
    y axis line style = {normal shift={y}{10pt}},
    z axis line style = {normal shift={z}{10pt}},
  }
}

\begin{document}
\begin{tikzpicture}
  \begin{axis}[range3frame, view={55}{45}]
    \addplot3[surf, colormap/hot2, samples=41, domain=0:360] {sin(x)*sin(y)};
  \end{axis}
\end{tikzpicture}
\end{document}