PGFplots.net
Drawing plots and diagrams with LaTeX and PGFplots
Skip to content
Menu
Home
Resources
About
Authors
Learn TikZ and PGFplots
TikZによるLaTeXグラフィックス 単行本
Search
Search for:
Search
Tag
:
mathematics
Posted on
January 10, 2021
March 10, 2021
Uncategorized
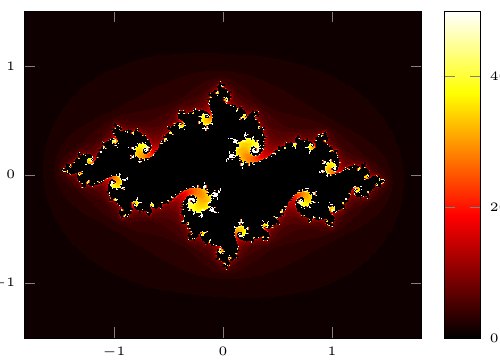
Julia set
Posted on
January 10, 2021
March 10, 2021
Uncategorized
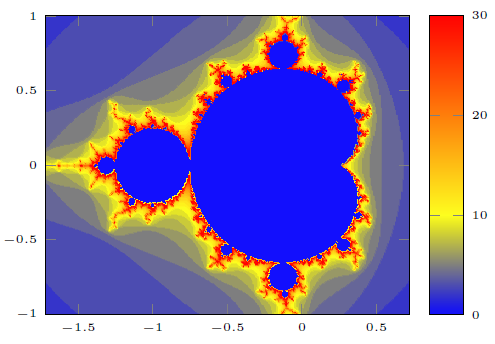
Mandelbrot set
Posted on
January 10, 2021
March 10, 2021
Uncategorized
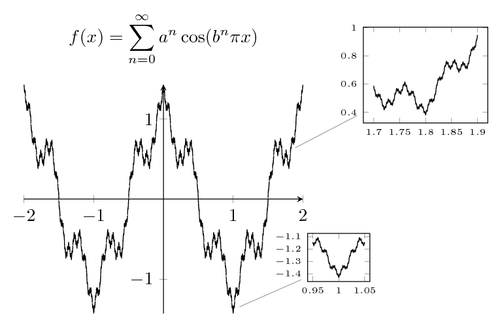
Weierstrass function
Posted on
January 10, 2021
March 3, 2025
Uncategorized
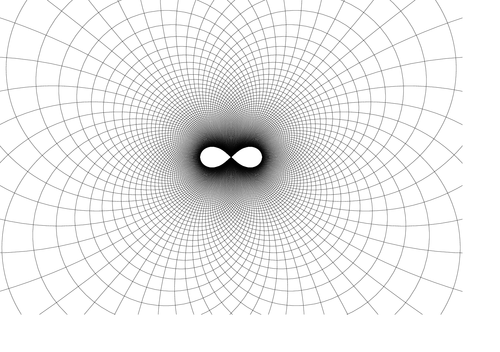
Lemniscate envelope
Posted on
January 10, 2021
January 10, 2021
Uncategorized
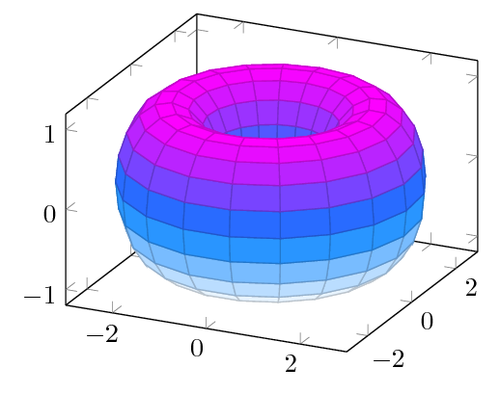
Torus
Posted on
January 10, 2021
January 10, 2021
Uncategorized
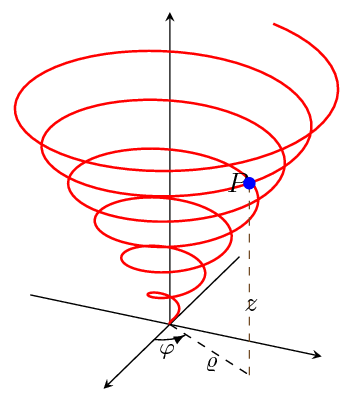
Spiral cone
Posted on
January 10, 2021
May 8, 2022
Uncategorized
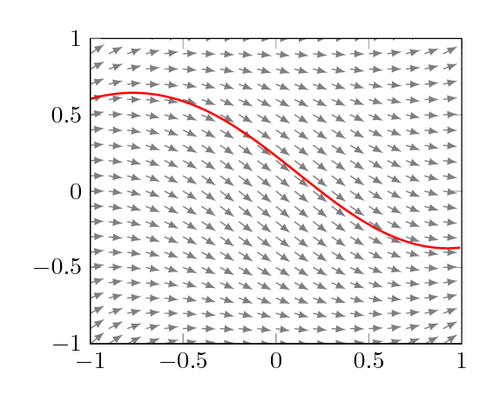
Differential equation direction plot
Posted on
January 10, 2021
May 8, 2022
Uncategorized
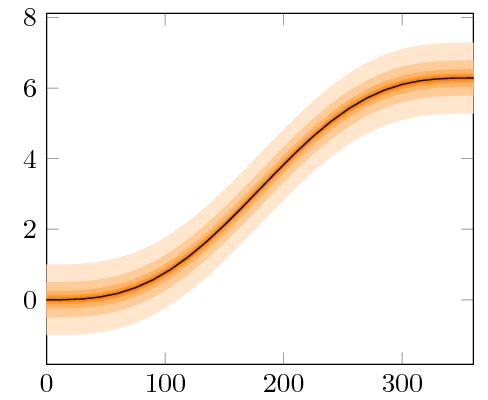
Plot with error intervals
Posted on
January 10, 2021
May 8, 2022
Uncategorized
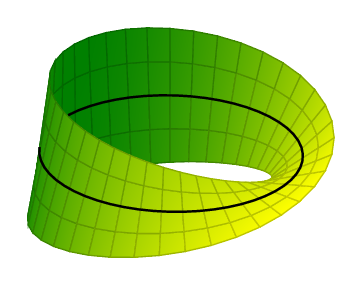
Moebius strip
Posts pagination
Previous Page
Page
1
Page
2
Page
3
Page
4
Next Page