


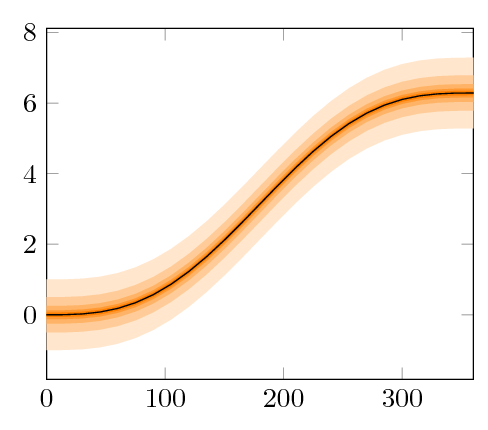
Here, the trick is to use stack plots=y together with closedcycle to create the error bands.
We define a new command, \addplotwitherrorbands[<optional styles>]{<function>}{<positive error>} {<negative error>} for this spurpose.
\documentclass[border=5pt]{standalone}
\usepackage{pgfplots}
\pgfplotsset{width=7cm,compat=1.8}
\tikzset{
    error band/.style={fill=orange},
    error band style/.style={
        error band/.append style=#1
    }
}
\newcommand{\addplotwitherrorband}[4][]{
  \addplot [#1, draw=none, stack plots=y, forget plot] {#2-(#3)};
  \addplot +[#1, draw=none, stack plots=y, error band] {(#3)+(#4)}\closedcycle;
  \addplot [#1, draw=none, stack plots=y, forget plot] {-(#2)-(#3)};
  \addplot [#1, forget plot] {#2};
}
\begin{document}
\begin{tikzpicture}[
    declare function={f(\x)=rad(\x)-sin(\x);}
  ]
  \begin{axis}[domain = 0:360, enlarge x limits = false,
      cycle list = {
        error band style = orange!20\\
        error band style = orange!40\\
        error band style = orange!60\\
        error band style = orange!80\\
        error band style = orange!100\\
      }
    ]
    \pgfplotsinvokeforeach{1,0.5,0.25,0.125, 0.0625} {
      \addplotwitherrorband [] {f(x)}{#1}{#1}
    }
  \end{axis}
\end{tikzpicture}
\end{document}