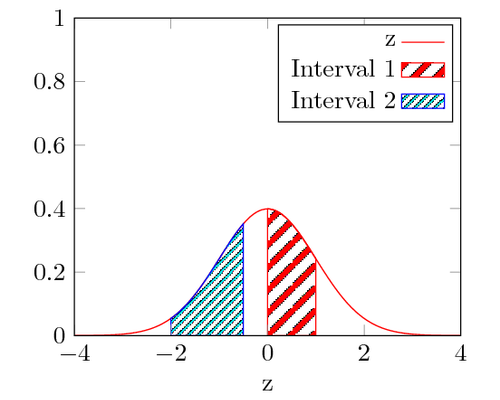
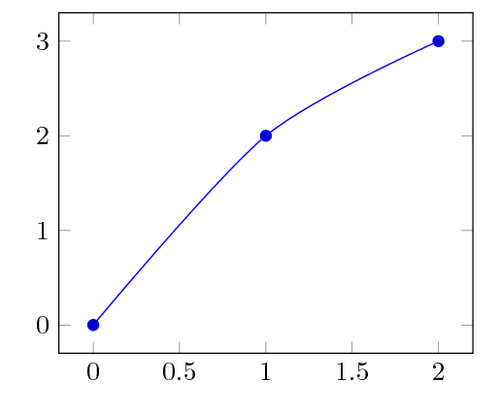
Similar to the “Economist” style, we don’t use a vertical grid, avoid tick marks, and place the axis at the right, to highlight the latest…
An application of volumes of revolution for plotting a three-dimensional heart. If your TeX installation would throw an error “TeX capacity exceeded”, you could use…
Besides x and y values, special markers illustrate the result. This topic was discussed on: http://texwelt.de/wissen/fragen/3363/ \documentclass[border=10pt]{standalone} \usepackage{pgfplots} \pgfplotsset{width=7cm, compat=1.8, grid style={dashed}} \begin{document} \begin{tikzpicture} \begin{axis}[…
With pgfplots 1.10 and its fillbetween library we can fill the area between curves in a new convenient way: draw the first function and give…
A sine curve, where the y-values do not exceed a certain value. PGFPlots has two different types of clipping: the first is the graphical clipping…
We want to visualize two functions. The first function is given by means of a data table. The second function is given by means of…
We would like to create a heatmap using TikZ. Basically, we have a table of values and each value is assigned a color. We map…
Here’s a way of doing Mathematica 9 style plots with PGFPlots: the first plot is simply a ycomb plot, and the second we can draw…