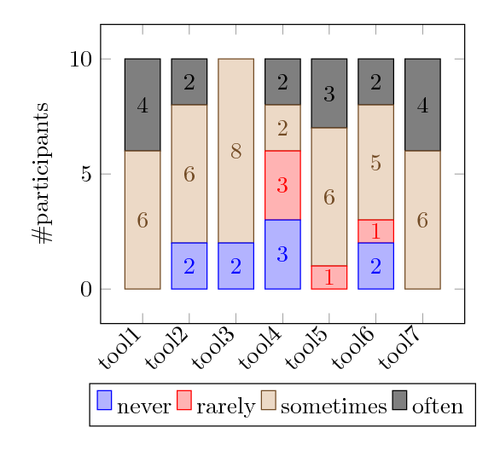
Stacking plots means to add either x or y coordinates of successive addplot commands on top of each other.
The code is from the PGFPlots 1.10 manual: “4.5.8 Stacked Plots”, “Stacked Bar Plots and Nodes Near Coords”.
Edit and compile if you like:\documentclass[border=10pt]{standalone}
\usepackage{pgfplots}
\pgfplotsset{width=7cm,compat=1.8}
\begin{document}
\begin{tikzpicture}
\begin{axis}[
ybar stacked,
bar width=15pt,
nodes near coords,
enlargelimits=0.15,
legend style={at={(0.5,-0.20)},
anchor=north,legend columns=-1},
ylabel={\#participants},
symbolic x coords={tool1, tool2, tool3, tool4,
tool5, tool6, tool7},
xtick=data,
x tick label style={rotate=45,anchor=east},
]
\addplot+[ybar] plot coordinates {(tool1,0) (tool2,2)
(tool3,2) (tool4,3) (tool5,0) (tool6,2) (tool7,0)};
\addplot+[ybar] plot coordinates {(tool1,0) (tool2,0)
(tool3,0) (tool4,3) (tool5,1) (tool6,1) (tool7,0)};
\addplot+[ybar] plot coordinates {(tool1,6) (tool2,6)
(tool3,8) (tool4,2) (tool5,6) (tool6,5) (tool7,6)};
\addplot+[ybar] plot coordinates {(tool1,4) (tool2,2)
(tool3,0) (tool4,2) (tool5,3) (tool6,2) (tool7,4)};
\legend{\strut never, \strut rarely, \strut sometimes, \strut often}
\end{axis}
\end{tikzpicture}
\end{document}

