


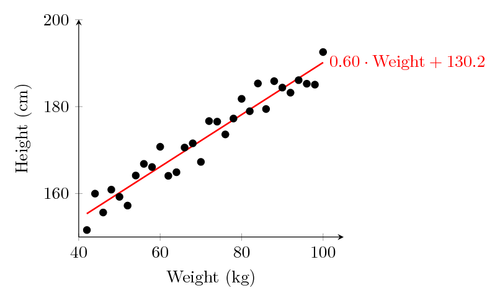
We would like to draw a regression line through some points. For an illustration, we will generate random points.
PGFPlots can calculate the regression line only for tabulated data, so you will have to create the points in a table. You can do this using pgfplotstablenew.
The coefficients of the regression line are stored in the macros pgfplotstableregressiona and pgfplotstableregressionb.
\documentclass[border=5pt]{standalone}
\usepackage{pgfplots}
\pgfplotsset{width=7cm,compat=1.8}
\usepackage{pgfplotstable}
\pgfmathsetseed{1138} % set the random seed
\pgfplotstableset{ % Define the equations for x and y
    create on use/x/.style={create col/expr={42+2*\pgfplotstablerow}},
    create on use/y/.style={create col/expr={(0.6*\thisrow{x}+130)+5*rand}}
}
% create a new table with 30 rows and columns x and y:
\pgfplotstablenew[columns={x,y}]{30}\loadedtable
\begin{document}
\begin{tikzpicture}
  \begin{axis} [
      xlabel     = Weight (kg), % label x axis
      ylabel     = Height (cm), % label y axis
      axis lines = left, %set the position of the axes
      clip       = false,
      xmin = 40,  xmax = 105, % set the min and max values of the x-axis
      ymin = 150, ymax = 200, % set the min and max values of the y-axis
    ]
    \addplot [only marks] table {\loadedtable};
    \addplot [no markers, thick, red]
      table [y={create col/linear regression={y=y}}] {\loadedtable}
      node [anchor=west] {$\pgfmathprintnumber[precision=2, fixed zerofill]
      {\pgfplotstableregressiona} \cdot \mathrm{Weight} +
      \pgfmathprintnumber[precision=1]{\pgfplotstableregressionb}$};
  \end{axis}
\end{tikzpicture}
\end{document}