


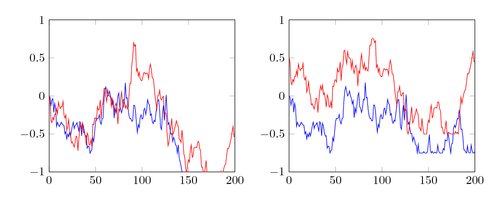
Here’s an approach using pgfplotstable to calculate the Brownian motions as cumulative sums of random normally distributed values. You have to first initialize an empty table, using something like \pgfplotstablenew{200}loadedtable, and then you can draw the brownian motions using \addplot table [brownian motion] {loadedtable};.
You can set the initial value and the maximum and minimum values using \addplot table [brownian motion={start=0.5, min=-1, max=1}] {loadedtable};
This code was written by Jake on TeX.SE.
\documentclass[border=10pt]{standalone}
\usepackage{pgfplots}
\pgfplotsset{width=7cm,compat=1.8}
\usepackage{pgfplotstable}
% Create a function for generating inverse normally distributed numbers using the Box–Muller transform
\pgfmathdeclarefunction{invgauss}{2}{%
  \pgfmathparse{sqrt(-2*ln(#1))*cos(deg(2*pi*#2))}%
}
% Code for brownian motion
\makeatletter
\pgfplotsset{
    table/.cd,
    brownian motion/.style={
        create on use/brown/.style={
            create col/expr accum={
                (\coordindex>0)*(
                    max(
                        min(
                            invgauss(rnd,rnd)*0.1+\pgfmathaccuma,
                            \pgfplots@brownian@max
                        ),
                        \pgfplots@brownian@min
                    )
                ) + (\coordindex<1)*\pgfplots@brownian@start
            }{\pgfplots@brownian@start}
        },
        y=brown, x expr={\coordindex},
        brownian motion/.cd,
        #1,
        /.cd
    },
    brownian motion/.cd,
            min/.store in=\pgfplots@brownian@min,
        min=-inf,
            max/.store in=\pgfplots@brownian@max,
            max=inf,
            start/.store in=\pgfplots@brownian@start,
        start=0
}
\makeatother

% Initialise an empty table with a certain number of rows
\pgfplotstablenew{201}\loadedtable % How many steps?
\pgfplotsset{
        no markers,
        xmin=0,
        enlarge x limits=false,
        scaled y ticks=false,
        ymin=-1, ymax=1
}
\tikzset{line join=bevel}
\begin{document}
\pgfmathsetseed{3}
\begin{tikzpicture}
  \begin{axis}
   \addplot table [brownian motion] {\loadedtable};
   \addplot table [brownian motion] {\loadedtable};
  \end{axis}
\end{tikzpicture}

\pgfmathsetseed{3}
\begin{tikzpicture}
  \begin{axis}
    \addplot table [
        brownian motion = {%
            max =  0.5,
            min = -0.75
        }
    ] {\loadedtable};
    \addplot table [
        brownian motion = {%
            start =  0.5,
            min   = -0.5,
            max   =  0.75
        }
    ] {\loadedtable};
  \end{axis}
\end{tikzpicture}
\end{document}