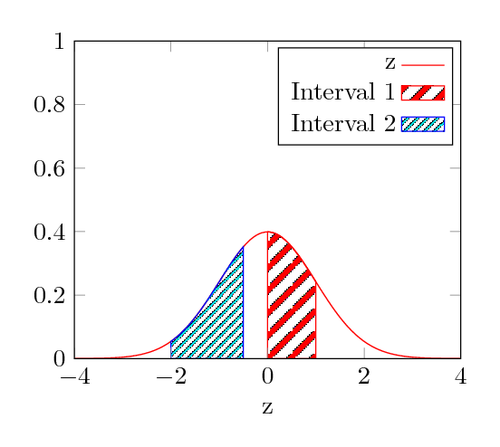
We would like to fill areas below a curve with different line patterns. We define our own pattern that can take optional arguments for setting the distance between the lines and the line thickness.
To make sure the axis line stays black, we can set axis on top, which will draw the axis lines last.
And to get the hatch pattern in the legend as well, we add the key area legend to the plot.
This code was written by Jake on TeX.SE.
Edit and compile if you like:\documentclass[border=10pt]{standalone}
\usepackage{pgfplots}
\pgfplotsset{width=7cm,compat=1.8}
\usetikzlibrary{patterns}
\begin{document}
\begin{tikzpicture}[
hatch distance/.store in=\hatchdistance,
hatch distance=10pt,
hatch thickness/.store in=\hatchthickness,
hatch thickness=2pt
]
\makeatletter
\pgfdeclarepatternformonly[\hatchdistance,\hatchthickness]{flexible hatch}
{\pgfqpoint{0pt}{0pt}}
{\pgfqpoint{\hatchdistance}{\hatchdistance}}
{\pgfpoint{\hatchdistance-1pt}{\hatchdistance-1pt}}%
{
\pgfsetcolor{\tikz@pattern@color}
\pgfsetlinewidth{\hatchthickness}
\pgfpathmoveto{\pgfqpoint{0pt}{0pt}}
\pgfpathlineto{\pgfqpoint{\hatchdistance}{\hatchdistance}}
\pgfusepath{stroke}
}
\begin{axis}[
xmin=-4,xmax=4,
xlabel={z},
ymin=0,ymax=1,
axis on top,
legend style={legend cell align=right,legend plot pos=right}]
\addplot[color=red,domain=-4:4,samples=100] {1/sqrt(2*pi)*exp(-x^2/2)};
\addlegendentry{z}
\addplot+[mark=none,
domain=0:1,
samples=100,
pattern=flexible hatch,
area legend,
pattern color=red]{1/sqrt(2*pi)*exp(-x^2/2)} \closedcycle;
\addlegendentry{Interval 1}
\addplot+[mark=none,
domain=-2:-0.5,
samples=100,
pattern=flexible hatch,
hatch distance=5pt,
hatch thickness=0.5pt,
draw=blue,
pattern color=cyan,
area legend]{1/sqrt(2*pi)*exp(-x^2/2)} \closedcycle;
\addlegendentry{Interval 2}
\end{axis}
\end{tikzpicture}
\end{document}

