


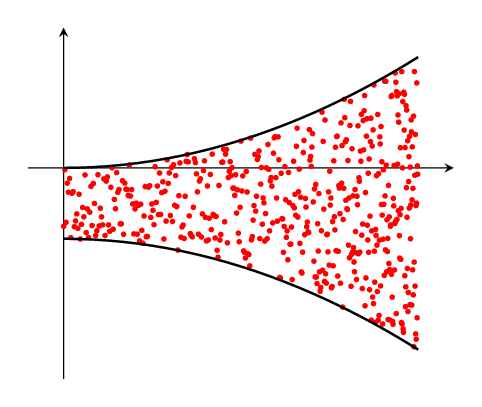
Here we fill an area between two curves with random dots.
If the curved had a nearly equal distance, we could add points between, with some noise generated using a uniform distribution centered halfway between the curves with a range equal to the offset between the curves. The higher the number of samples, the denser the pattern.
However, things get more complicated when you have two curves that aren’t a constant distant apart: in that case, the density of the random dots would not be constant throughout the domain.
To achieve a constant density, you’ll need to adjust the horizontal distribution of the random points. So instead of the points being a noisy function of x, we’ll use a parametric equation ( x(t), 0.5*a(x(t)) + 0.5*b(x(t)) + U(a(x(t)), b(x(t))).
The horizontal distance between two adjacent points has to be inversely proportional to the distance between the two bounding curves (since you need more points to fill a wider band).
To find the horizontal positions for the points that fulfill that requirements, you can use the antiderivative of the inverse of the difference of the two bounding curves.
In this case, for example, you would need the antiderivative of f(x) = 1/(a(x)-b(x)) = 1 / (2*(x/4)^2+1). I think I should be able to do this by hand, but I cheated and used Wolfram Alpha. The required function is F(x) = 2 sqrt(2) (atan(x/(2 sqrt(2)))). In order to stretch this function over the plot domain, you can normalize it using the factor x_max/F(x_max). The function for the horizontal positions of the points is thus:
F*(t) = 2 sqrt(2) (atan(t/(2*sqrt(2)))) * 5 / 2.99
This code was written by Jake on TeX.SE.
\documentclass[border=10pt]{standalone}
\usepackage{pgfplots}
\pgfplotsset{width=7cm,compat=1.8}
\begin{document}
\begin{tikzpicture}[
    declare function={a(\x)=(\x/4)^2;},
    declare function={b(\x)=-(\x/4)^2-1;},
    declare function={f(\x) = 2*sqrt(2)*rad(atan(\x/(2*sqrt(2))))*5/2.99;}
]
\begin{axis}[
    domain=0:5, xmin=0,
    axis lines=middle,
    axis equal image,
    xtick=\empty, ytick=\empty,
    enlargelimits=true,
    clip mode=individual, clip=false
]
\addplot [red, only marks, mark=*, samples=500, mark size=0.75]
    (f(x), {0.5*(a(x)+b(x)) + rand * ( a(f(x)) - b(f(x))) / 2});
\addplot [thick] {a(x)};
\addplot [thick] {b(x)};
\end{axis}
\end{tikzpicture}
\end{document}