


\documentclass[tikz,border=10pt]{standalone}
\usepackage{pgfplots}
\begin{document}
\pgfmathdeclarefunction{gauss}{2}{%
\pgfmathparse{1/(#2*sqrt(2*pi))*exp(-((x-#1)^2)/(2*#2^2))}%
}
\begin{tikzpicture}
\begin{axis}[
no markers, domain=0:10, samples=100,
axis lines*=left, xlabel=$x$, ylabel=$y$,
every axis y label/.style={at=(current axis.above origin),anchor=south},
every axis x label/.style={at=(current axis.right of origin),anchor=west},
height=5cm, width=12cm,
xtick={4,6.5}, ytick=\empty,
enlargelimits=false, clip=false, axis on top,
grid = major
]
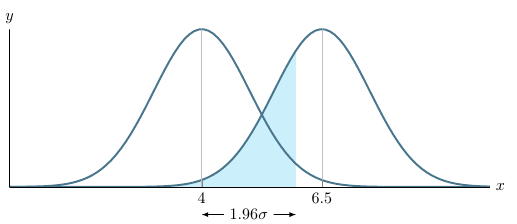
\addplot [fill=cyan!20, draw=none, domain=0:5.96] {gauss(6.5,1)} \closedcycle;
\addplot [very thick,cyan!50!black] {gauss(4,1)};
\addplot [very thick,cyan!50!black] {gauss(6.5,1)};
\draw [yshift=-0.6cm, latex-latex](axis cs:4,0) -- node [fill=white] {$1.96\sigma$} (axis cs:5.96,0);
\end{axis}
\end{tikzpicture}
\end{document}
To shade the area under a curve, I supplied [domain=