


You can use pgfplots to plot your own functions. There’s no standard macro for it, but the function isn’t too complicated and can be added as a pgfmath function.
This code was written by Jake on TeX.SE.
\documentclass[border=10pt]{standalone}
\usepackage{pgfplots}
\pgfplotsset{width=7cm,compat=1.8}
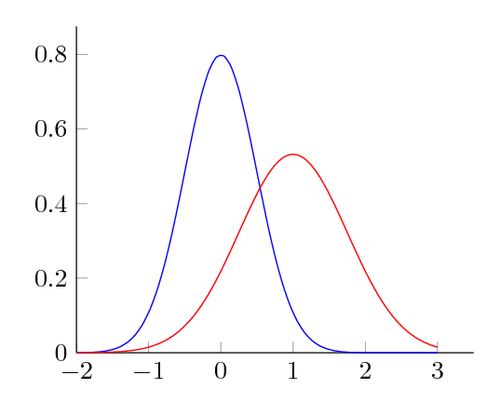
\pgfmathdeclarefunction{gauss}{2}{%
\pgfmathparse{1/(#2*sqrt(2*pi))*exp(-((x-#1)^2)/(2*#2^2))}%
}
\begin{document}
\begin{tikzpicture}
\begin{axis}[every axis plot post/.append style={
mark=none,domain=-2:3,samples=50,smooth},
% All plots: from -2:2, 50 samples, smooth, no marks
axis x line*=bottom, % no box around the plot, only x and y axis
axis y line*=left, % the * suppresses the arrow tips
enlargelimits=upper] % extend the axes a bit to the right and top
\addplot {gauss(0,0.5)};
\addplot {gauss(1,0.75)};
\end{axis}
\end{tikzpicture}
\end{document}