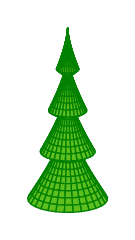
A Christmas tree plot.
Edit and compile if you like:\documentclass[border=10pt]{standalone}
\usepackage{pgfplots}
\pgfplotsset{width=7cm,compat=1.8}
\begin{document}
\begin{tikzpicture}
\begin{axis}[
hide axis, clip=false,
y domain=0:2*pi,
samples=30,axis equal, view={45}{20}]
\addplot3 [
domain=0:4,
surf,
shader=flat,
z buffer=sort,
fill=green!50!brown,
draw=green!50!black,
line join=bevel
]
( {(1.3*x-floor(x))*x^0.5*cos(deg(y))},
{(1.3*x-floor(x))*x^0.5*sin(deg(y))},
{-5*x}
);
addplot3 [
domain=0:4.5,
samples=10,
samples y=0,
fill=yellow!85!red,
draw=yellow!55!red
]
( {0},
{sin(x/5*360) * (1 - x + floor(x)) },
{cos(x/5*360) * (1 - x + floor(x) ) + 0.5}
) -- cycle;
\end{axis}
\end{tikzpicture}
\end{document}
