


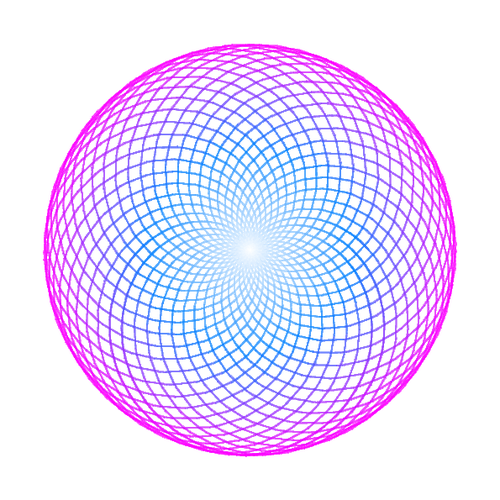
The sine function is a well known periodic function. Choose an argument factor, which doesn’t divide the period well, and you can see a complicated path around the origin.
This plot was originally made for my blog post on TikZ.de: http://tikz.de/periodisch/
See also the other polar sine plot examples there.
\documentclass[border=10pt]{standalone}
\usepackage{pgfplots}
\usepgfplotslibrary{polar,colormaps}
\begin{document}
\begin{tikzpicture}
  \begin{polaraxis}[
      domain  = -14400:14400,
      samples = 3000,
      colormap/cool,
      hide axis
    ]
    \addplot[no markers, mesh, opacity=0.5] {1-sin(40*x/39};
  \end{polaraxis}
\end{tikzpicture}
\end{document}