


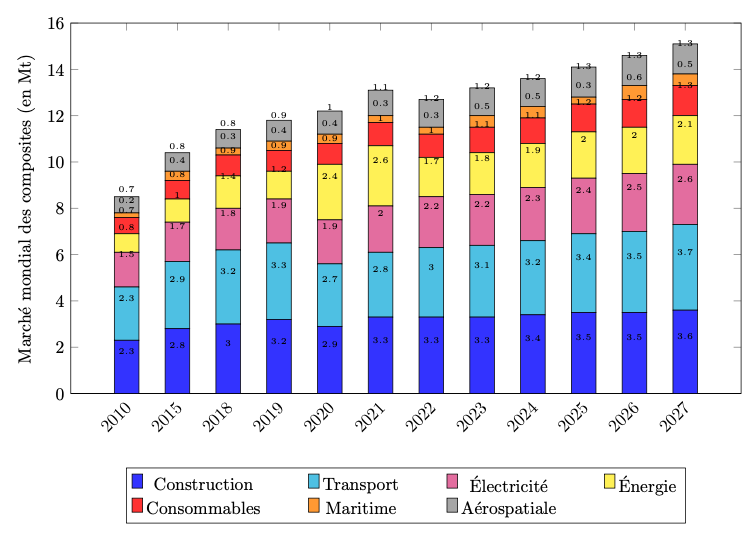
Évolution du marché mondial des composites par secteur d’application (2010-2027). Les données montrent la dominance historique du Transport et la croissance rapide du secteur Énergie.
Evolution of the global composites market by application sector (2010–2027). The data show the historical dominance of the Transport sector and the rapid growth of the Energy sector.
\documentclass[tikz,border=10pt]{standalone}
\usepackage{pgfplots}
\usepackage{pgfplotstable}
\pgfplotsset{compat=1.18}
\begin{document}
\begin{tikzpicture}
  \begin{axis}[
    ybar stacked,
    symbolic x coords = { 2010,2015,2018,2019,2020,2021,
                          2022,2023,2024,2025,2026,2027 },
    xtick = data,
    xticklabel style = {rotate = 45, anchor = east, yshift = -5pt},
    ymin = 0, ymax = 16,
    ylabel = {Marché mondial des composites (en Mt)},
    legend style = {
      at = {(0.5, -0.2)},
      anchor = north,
      legend columns = 4,
      /tikz/every even column/.append style = {column sep = 2.5em} },
    width = 15cm, height = 9cm,
    bar width = 14pt,
    nodes near coords, nodes near coords align = {vertical},
    every node near coord/.style = {
      font   = \tiny,
      color  = black,
      yshift = 4pt
    } ]
    \addplot[fill=blue!80] coordinates {(2010,2.3) (2015,2.8) (2018,3)
      (2019,3.2) (2020,2.9) (2021,3.3) (2022,3.3) (2023,3.3) (2024,3.4)
      (2025,3.5) (2026,3.5) (2027,3.6)};
    \addplot[fill=cyan!60] coordinates {(2010,2.3) (2015,2.9) (2018,3.2)
      (2019,3.3) (2020,2.7) (2021,2.8) (2022,3) (2023,3.1) (2024,3.2)
      (2025,3.4) (2026,3.5) (2027,3.7)};
    \addplot[fill=magenta!70] coordinates {(2010,1.5) (2015,1.7)
      (2018,1.8) (2019,1.9) (2020,1.9) (2021,2) (2022,2.2) (2023,2.2)
      (2024,2.3) (2025,2.4) (2026,2.5) (2027,2.6)};
    \addplot[fill=yellow!80] coordinates {(2010,0.8) (2015,1) (2018,1.4)
      (2019,1.2) (2020,2.4) (2021,2.6) (2022,1.7) (2023,1.8) (2024,1.9)
      (2025,2) (2026,2) (2027,2.1)};
    \addplot[fill=red!80] coordinates {(2010,0.7) (2015,0.8) (2018,0.9)
      (2019,0.9) (2020,0.9) (2021,1) (2022,1) (2023,1.1) (2024,1.1)
      (2025,1.2) (2026,1.2) (2027,1.3)};
    \addplot[fill=orange!80] coordinates {(2010,0.2) (2015,0.4)
      (2018,0.3) (2019,0.4) (2020,0.4) (2021,0.3) (2022,0.3)
      (2023,0.5) (2024,0.5) (2025,0.3) (2026,0.6) (2027,0.5)};
    \addplot[fill=gray!70] coordinates {(2010,0.7) (2015,0.8) (2018,0.8)
      (2019,0.9) (2020,1) (2021,1.1) (2022,1.2) (2023,1.2) (2024,1.2)
      (2025,1.3) (2026,1.3) (2027,1.3)};
    \legend{ Construction, Transport, Électricité, Énergie,
             Consommables, Maritime, Aérospatiale}
  \end{axis}
\end{tikzpicture}
\end{document}