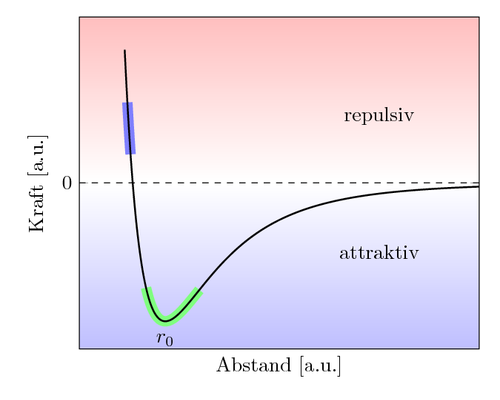
Here we can see how parts of a curve can be emphasized. A color shading partitions the plane. The code is from a question by…
Two series will be shown in a bar plot. Additionally, they contain sub series, which we would like to plot in the same diagram. So…
A group plot example, posted by Elke Schubert on TeXwelt.de. \documentclass[margin=5mm]{standalone} \usepackage{pgfplots} \pgfplotsset{compat=1.8} \usepackage{pgfplotstable} \usepgfplotslibrary{groupplots} \begin{document} \begin{tikzpicture} % Read the file % if needed, define…
Besides x and y values, special markers illustrate the result. This topic was discussed on: http://texwelt.de/wissen/fragen/3363/ \documentclass[border=10pt]{standalone} \usepackage{pgfplots} \pgfplotsset{width=7cm, compat=1.8, grid style={dashed}} \begin{document} \begin{tikzpicture} \begin{axis}[…