


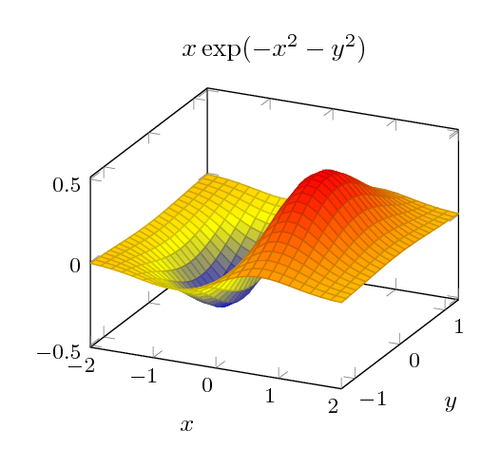
We would like to plot a function of two variables given by the math expression exp(-x^2 – y^2) * x.
The code is from the PGFPlots 1.10 manual: “3.5.4 Computing a Contour Plot of a Math Expression”.
\documentclass[border=10pt]{standalone}
\usepackage{pgfplots}
\pgfplotsset{width=7cm,compat=1.8}
\begin{document}
\begin{tikzpicture}
\begin{axis}[
    title={$x \exp(-x^2-y^2)$},
    xlabel=$x$, ylabel=$y$,
	small,
]
\addplot3[
	surf,
	domain=-2:2,
	domain y=-1.3:1.3,
]
	{exp(-x^2-y^2)*x};
\end{axis}
\end{tikzpicture}
\end{document}