

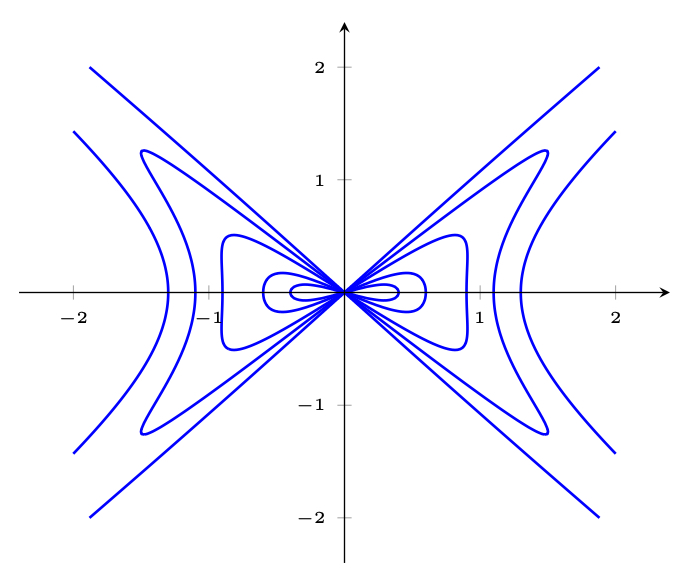
From mathcurve.com: Alain’s curve (studied by Alain Juhel) is the projection of the intersection of the elliptical cone c²z²=a²x²-b²y² with the hyperbolic paraboloid cz=x²-y² onto the xy plane:
So it makes sense to plot that xy projection as 0-level contour plot of a 3D surface. The equation (x² – y²)² = a²*x² + b²*y² means plotting the zero level of f(x,y,a,b) = (x² – y²)² = a²*x² + b²*y².
Here’s a picture posted by @MathGuyTFL on X:

With LaTeX and pgfplots, you can quickly define Alain’s curve implicitly and easily render it with contour plots (requiring LuaLaTeX!) using a \foreach loop for parameters. Much of the code is just choosing the axis style. So, I plotted it with the same a and b parameters:
%!TEX lualatex
\documentclass[border=10pt]{standalone}
\usepackage{pgfplots}
\pgfplotsset{compat=1.18}
\begin{document}
\begin{tikzpicture}[
  declare function = {
    f(\x,\y,\a,\b) = (x^2 - y^2)^2
      - \a^2*x^2 + \b^2*y^2; } ]
  \begin{axis}[
     tick label style = {font = \sffamily\tiny},
     axis lines = middle,
     domain     = -2:2,
     samples    = 200,
     samples y  = 200,
     enlargelimits,
     view = {0}{90},
     every axis plot/.style = {thick, no markers,
       contour lua = { levels = {0}, labels = false}}]
   \foreach \a in {0.4, 0.6, 0.9, 1.1, 1.3}
     \addplot3 { f(x, y, \a, 1.2) };
  \end{axis}
\end{tikzpicture}
\end{document}
Due to many samples and several plots, compiling takes a long time. Better do it on your own computer and not on this website’s online compiler, it would time out here.
That’s the result:
I posted this on X.